In the article, we will learn step by step, how to create a Power BI Report using Microsoft Dynamics 365 CE as the data source.
- 1. Create Dynamics 365 Trial, and set up the Sales app, to begin with.
-
2. Login to Dynamics 365 Instance and navigate to Settings → Data Management to install the Sample Data.
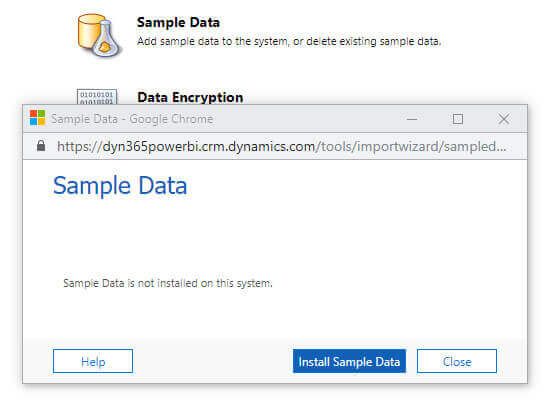
- 3. The Power BI Report that we will create here would be on Case entity i.e. “Cases by Importance and Position” using the example data that we installed.
-
4. Open Power BI home and click on Start Free link and download Power BI Desktop, which will be the tool we will be using to author Power BI Report

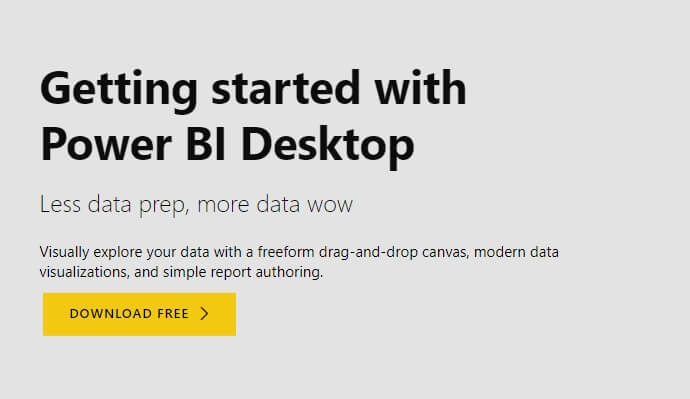
Alternate link to download Power BI Desktop
-
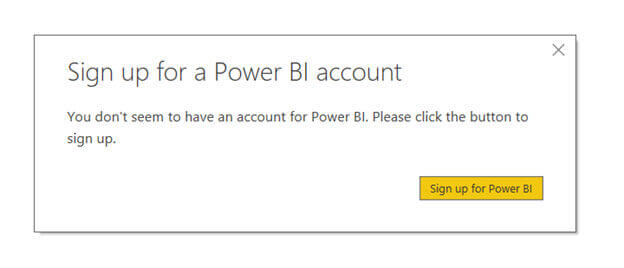
5. After installation, open Power BI Desktop and sign in with the account used for creating the trial (which is also the administrator user in Dynamics 365 CE here). Finish the sign up using Sign up for Power BI and login to Power Bi Desktop.
-
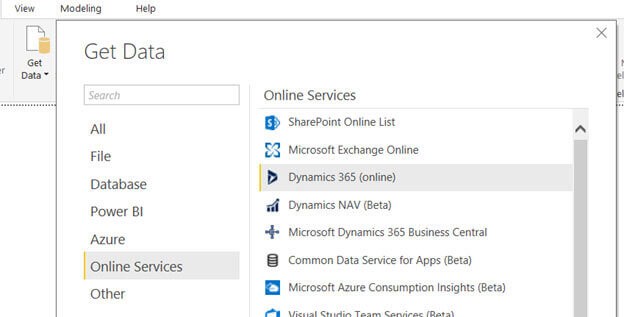
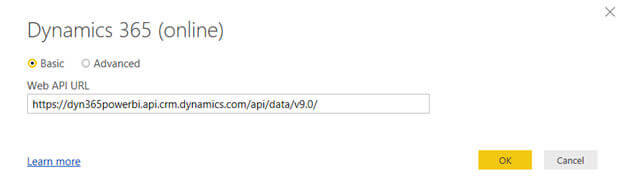
6. Now let us connect to our trial instance. Click on Get Data and select Dynamics 365 Online and click Connect
-
7. Navigate to Settings go to → Customization → Developer Resources And, copy the Service Root URL for the Instance Web API.
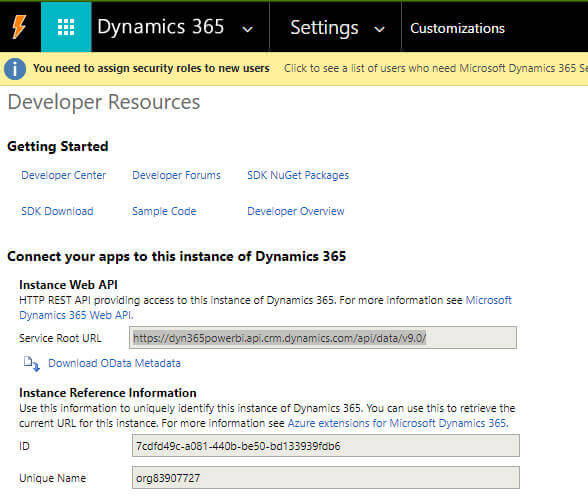
And specify it for Web API URL in the Power BI
-
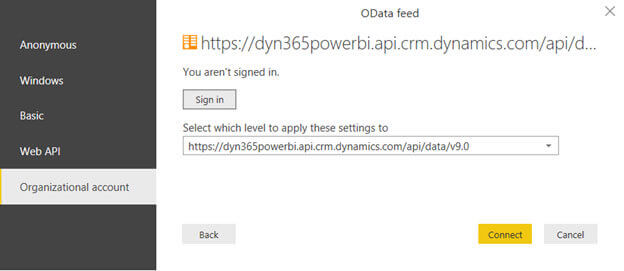
8. Select Organization Account, Sign In and click on connect
-
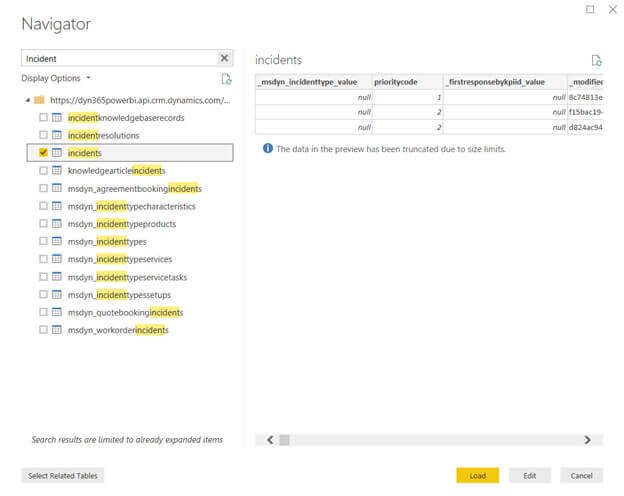
9. Search for Incident (Case) Entity, select it and click on Edit in the Navigator Dialog box, which allows us to select the columns we need for the report.
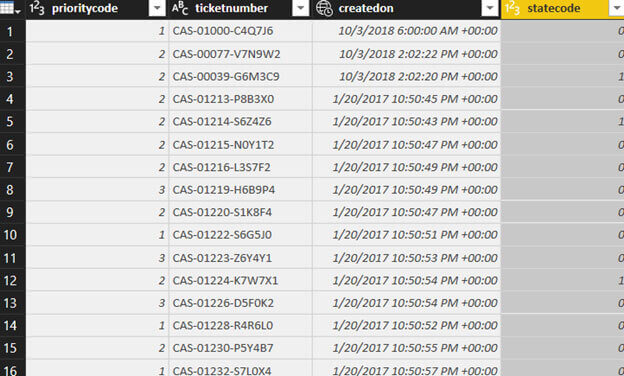
- 10. Click on Choose Columns and search and select the following fields to be used in the report. We should only select those fields that required instead of all the fields for improving the report’s performance. • Ticket Number • Priority • State Code • Created On
-
11. Inside Power BI Query Editor we’d see that option set field have values instead of a label, which is not very intuitive for the end user who is going to use that report.
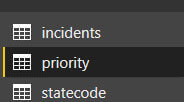
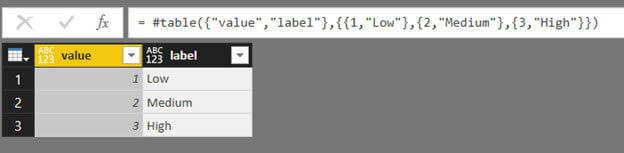
- 12. As we are dealing with very few values let us create new queries and manually specify their values. Another option is to use the PowerBIOptionSetAssistant plugin.
-
13. Right-click Queries section and select new blank query and define two tables as shown below
-
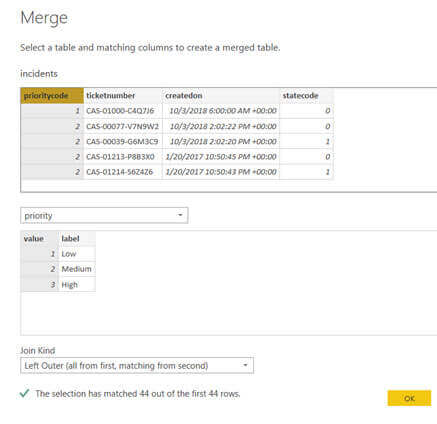
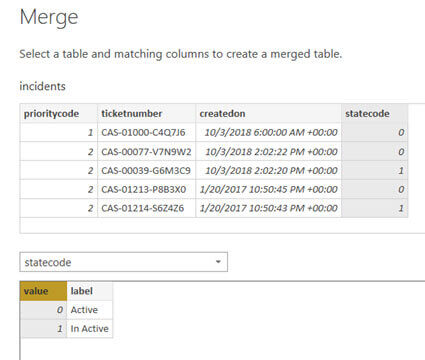
14. Now use “Merge Queries” for the main Incident Query and do a left join with these 2 new queries created as shown below.
-
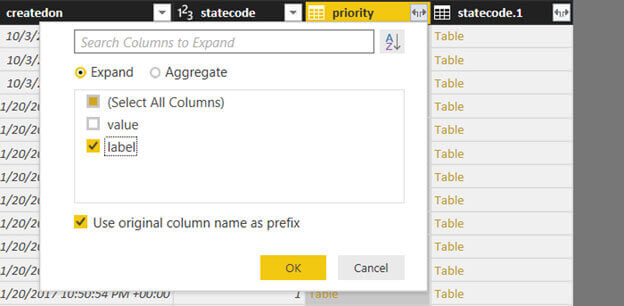
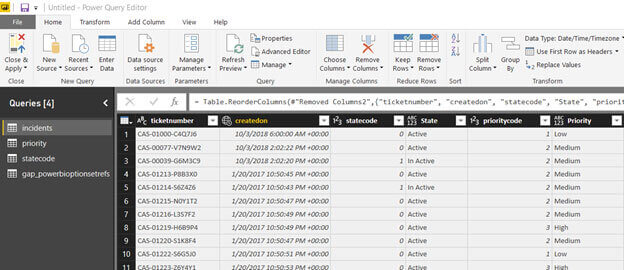
15. Expand the column and select the label field for both new columns added.
-
16. With the query ready now click on Close and Apply
-
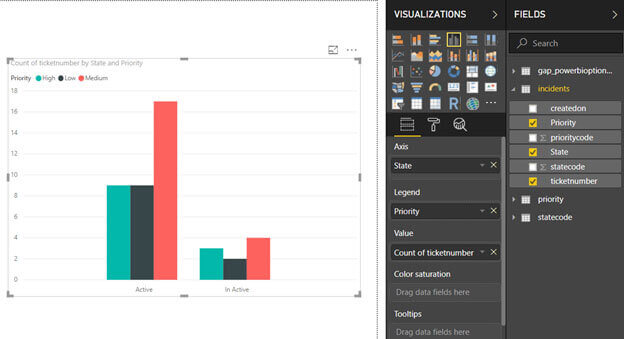
17. In the designer window, click any of the visualizations and specify the corresponding columns so. Below we have used a clustered column chart visualization and specified State for Axis, Priority for Legend and Count of ticket number as Value.
-
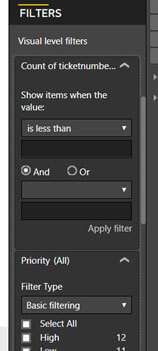
18. Power BI allows further filtering of the data inside the visualization based on fields selected for the report
-
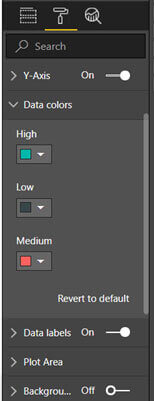
19. We can also change the properties of the visualization added, like show the data labels, specify the color of the bar etc.
Thus we saw how easy it is to author a Dynamics 365 CE Power BI Report which is highly interactive and highly customizable in few steps and without writing any single of code.
Stay here for learn, we will post next article for Embedding Power BI Dashboard and Report inside Microsoft Dynamics 365 CE in a few days.
Read more:
https://www.microsoft.com/en-us/download/details.aspx?id=45331